Despite Rio de Janeiro’s original and oldest favela just celebrating its 120th anniversary last month, it was not until fifty years later, in 1947, that the city’s favelas began to be included on official city maps, a visual exclusion that reflected much broader spatial exclusions from opportunities and even basic services such as mail delivery. In more recent years, neighborhoods that have not been digitally mapped have also been excluded from location-based services such as Uber. In anticipation of the 2014 World Cup and 2016 Olympic Games, Google and Microsoft competed to be the first to map the so-called “previously uncharted” favelas of Rio, even though during the same time period Google removed the word ‘favela’ from its online maps at the request of the city government. By the August 2016 Rio Olympics, Google and its local NGO partner, AfroReggae, had mapped 26 of Rio’s more than 1,000 favelas. However, their ‘On the Map’ project page suggests progress stopped there.
Google and Microsoft’s initiatives indicate increased visibility of favelas in mapping. However, no matter the apparent technical sophistication, those maps that do exist tend to lack in more practical and meaningful physical and social portrayals of favelas, indicating an unmet need to incorporate local knowledge into these representations.
Michel Silva, a Rocinha journalist, founder of community newspaper Fala Roça, and creator of the Cultural Map of Rocinha, noted that “the presence of favelas on Google Maps was very deficient” so he built his map in response. The Cultural Map documents more than 100 local points of interest such as an ecological park, meeting sites of diverse groups from the Rocinha Sem Fronteiras activists to a community choir, and numerous schools, daycares, and health centers, all of which serve to highlight the extent of local life that is missing from other maps of the community.
Furthermore, the limitations of Google’s web maps and official city maps include the unreliable ability of satellite imagery to distinguish between a cement roof or a street, resulting in misrepresentations and mislabeling of a favela’s layered morphology. In other maps, Silva says that “favelas—the majority—are green spots that signify forest. But many (human) lives exist in these favelas.”
Silva also criticizes the differentiation of the concept of “mapping the favela” from that of “mapping the city.” “The favela is the city” and must be represented as continuous with the rest of the city in maps, he argues. Although some locally developed mapping projects use Google’s standard aerial format as a template, subtle changes show that they have been manipulated to better reflect resident perceptions. Describing the Cultural Map of Rocinha, Silva says: “One observes that when you access the site, the map doesn’t open above Rocinha. It opens showing the city of Rio de Janeiro. This is important because Rocinha is also part of the city.”
Participatory mapping and social cartography (also referred to as insurgent cartography) are terms to describe two different processes that attempt to approach citizen control over the mapping process. “Participatory mapping” can refer to projects with a range of public participation levels—it can be used to describe projects in which citizens help only with data collection (such as being outfitted with gear to take street view photos for Google), or projects led by community-based organizations like Redes da Maré, in which the mapping process paired a community census project with a project to compile the histories of individual neighborhoods within Complexo da Maré.
Because mapping is an incremental process, each step must be evaluated for its degree of participation. Architect Nicoli Santos Ferraz breaks these phases of mapping into “idea, initiation, planning, collection of information, [and] insertion into the map.” Participatory mapping projects tend to employ citizen participation during the “collection of information” phase, often not including local groups from the mapping technologies themselves. Some examples that follow this model include UNICEF’s Digital Mapping Led by Adolescents and Youth and Google and AfroReggae’s On the Map, which involve the public in collecting data but the assembly and formatting of the final map is determined by outside parties. It is important to note that real value also comes out of this type of approach: the UNICEF mapping project, for example, integrates an app to capture evidence of injustices that would unlikely otherwise be made public.
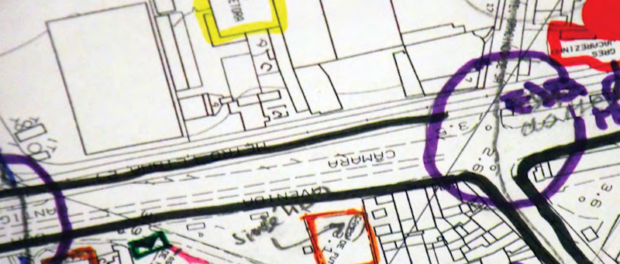
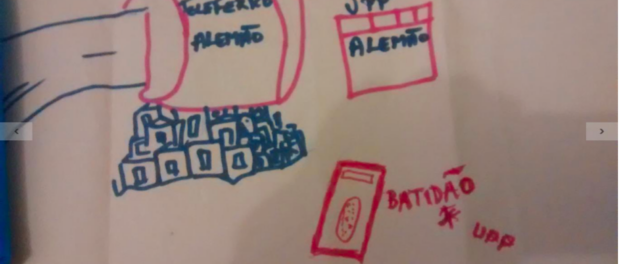
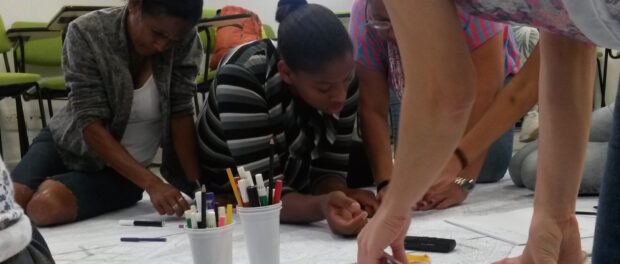
Social cartography differs from this methodology in that participants are given autonomy over all of the processes in the project. Fransérgio Goulart, an active member of the Youth Forum of Rio de Janeiro, describes social or insurgent cartography as being “constructed by the autonomous process and solidarity of social groups which, through acquiring political consciousness about the role of cartography, are able to replicate it in their day-to-day lives, strengthening struggles for identity-based rights, territorial rights, for public policies, and against racism and sexism.” He says that this autonomous process is essential to the shift away from the “normative process of institutional mapping.” The approach of social cartography encourages mental mapping—representing one’s individual experience in space—through any and all forms of expression, including hand-drawing and cartoon representations, free from pressure to use consistent symbols or formats.
Social cartography gained fame with the success of the New Social Cartography of the Amazon project in the Brazilian city of Manaus, and has been utilized by the Youth Forum in various favelas across the city and by the Federation of Organs for Social and Educational Assistance (Fase) to map the effects of militarization on the lives of women in Caju and Manguinhos. The New Social Cartography of the Amazon’s methodology mandates high levels of participant control: “researchers taught GPS techniques and mapping, beyond speaking with agents and and collecting testimonies about the social history and problems in the community” in order to allow community members to give more informed opinions on the mapping process and be as involved as possible.
Goulart explains that “good social cartography is when the symbols and the images are the images [developed by] the people themselves. So if an organization is represented with red points, that is already an externality. It’s not that there can’t be an external team to facilitate the cartographic process, but I think it impedes [it]. So, the symbols themselves offer a lot of information.” The Youth Forum’s social cartography project aimed to “identify, map, and georeference the violations of rights and violence specifically directed towards black youth in ‘militarized’ favelas.” Participating youth were given the power to construct their maps’ visual hierarchies, deciding what elements to emphasize and how. When asked to reflect on the police presence in communities, youth contributed “information that even falls against what we have… [in the] official data,” remarks Goulart. Significant locations for the participants, which may or may not be noted by outside organizations, feature centrally in these exercises. In an article for Ibase, Goulart explains that “slowly, favelas were appearing with elements that are normally silenced or hidden in traditional maps. Now appearing on the map, there are meeting places for youth, squares where parties are held, soirées, debates, soccer pitches, nurseries, schools, and other elements that are often left invisible in representations of the favela by outsiders.”
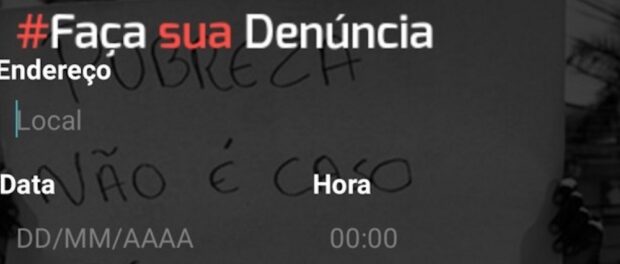
By encouraging participants to express themselves through a variety of mediums, there is freedom for participants to customize maps to their specific experiences. “This is the difference [from participatory mapping]… The individuals themselves construct the information about a determined reality through the design of the map,” clarifies Goulart. A map that better expresses locals’ realities is more likely to help reveal their needs and potential solutions. The Youth Forum mapping project, for example, resulted in the creation of the “Nós por Nós” (Us for Us) app, which is a platform for denouncing police violence. Users can photograph or film police crimes and abuses, and the content is automatically uploaded to the cloud and geolocated in case of damage to or destruction of the device by police.
However, because social cartography relies heavily on individual experiences, it can be met with some apprehension by participants. Fase’s report on its social cartography project in Caju and Manguinhos explains: “From the beginning, [participants] knew that when they constructed the maps it would be their individual experiences…that were going to narrate that space, and this [idea] initially created some discomfort and hesitation, but eventually resulted in a progressive appropriation of the process and its product: the maps.”
Both participatory mapping and social cartography are important for reforming institutional maps and creating versions that are suited to community needs and empowerment. Both question the traditional processes of mapping, emphasizing flexibility to adjust for specific local circumstances and display locally-relevant content rather than following a standard, static and distanced format. As such, they can serve community members and activists’ efforts to increase the visibility and comprehension of the complex diversity inherent to Rio’s favelas, challenging unproductively generic narratives about violence and poverty in favor of highlighting the wide range of experiences and perspectives that characterize these neighborhoods.


