As Olympics tickets remain cost prohibitive for a large number of Rio de Janeiro’s residents, including many from Rio’s favelas, on Wednesday, August 17, high-ranking member of the International Olympic Committee (IOC) Patrick Hickey was arrested in Rio for involvement in a ticket scalping scandal.
This incident does little to help the IOC and the Olympic movement’s reputation on the ground in Brazil, where recent protests have targeted the Olympic torch relay and mocked IOC symbols, or even abroad where athlete criticisms are growing. But how much is known about the inner workings of the IOC and its finances? Who is this elite clique of decision makers who each receive US$900 per diem spending allowances during the Games and whose choices permanently affect urban fabrics around the world? The following infographics are designed to give a numerical snapshot of some of the fundamentals of the IOC, the governing and administrative body of the Olympic Games, and the Olympic ‘movement’ overall.
Who are the members of the IOC?
Where are IOC members from?
What are IOC members’ business affiliations?
The data below was culled from the member bios available on the IOC’s website. Note that many IOC members listed multiple categories of previous experience in their bios.
How is the IOC structured?
The diagram below is an approximation of the administrative structure of the IOC, reconstructed from the organization’s website. The body is led by an executive committee comprised of one president, four vice presidents, and ten other rotating members. The remaining IOC members head various commissions (yellow). This structure is separate from the operational staff of the Olympic movement (teal), under the IOC director general. The IOC created the Olympic Broadcasting Services (purple) in 2001 to oversee its media empire. Also pictured are the various corporate entities (orange) and the regional organizing bodies (blue) that construct and execute the Olympic endeavor.
Where does Olympic revenue come from?
How has broadcasting revenue grown over time?
Currently in the USA, NBC holds an US$8 billion contract for the exclusive right to broadcast the Olympics until 2032.
How is the profit distributed?
This is a big one—as Olympic broadcasting revenues have grown, an increasing portion of that profit has been captured by the IOC rather than the host nation’s Olympic Organizing Committee or other local administrative bodies.
How does actual mega-event spending compare to budgeted expenditures?
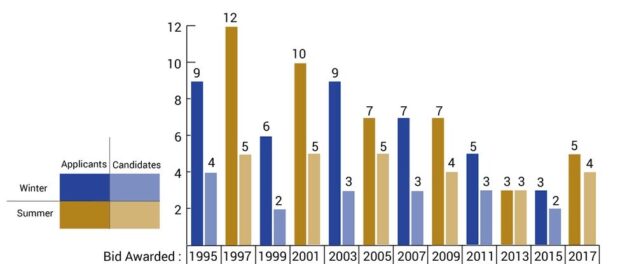
Who still wants to sign up for this?
Here we see the general decline in interest in hosting the Olympic Games over the past two decades. Note that this chart does not include applicants who canceled their application before candidates were chosen, nor candidates who withdrew before the bid was awarded.
These infographics are adapted from a graduate thesis project entitled Olympic Extrastagecraft: Spectacular Development and Dissent in Rio de Janeiro and New York City, 2016, written in solidarity with the local populations of Olympic host cities by Drew Vanderburg for the MS Design and Urban Ecologies at Parsons the New School for Design.


