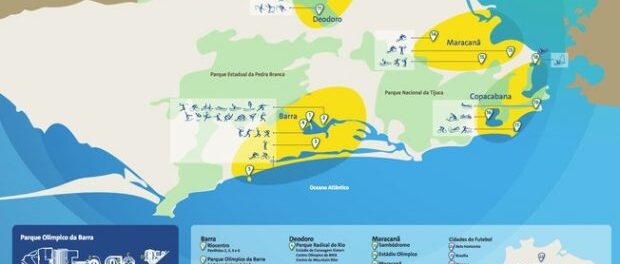
In a recent interview with The Guardian, Eduardo Paes, mayor of Rio de Janeiro, refuted allegations that Olympics investments have been concentrated only in rich parts of the city. “It’s crazy to say there is no investment in poor areas,” he said. “If people say this, they don’t know the geography [of the city].” He went on to say that “there has never been so much transformation for poor people [in Rio].”
If the question is about the geography of the city in relation to Olympics investments, let’s go back to the basics of geography studies and look at some maps and statistics.
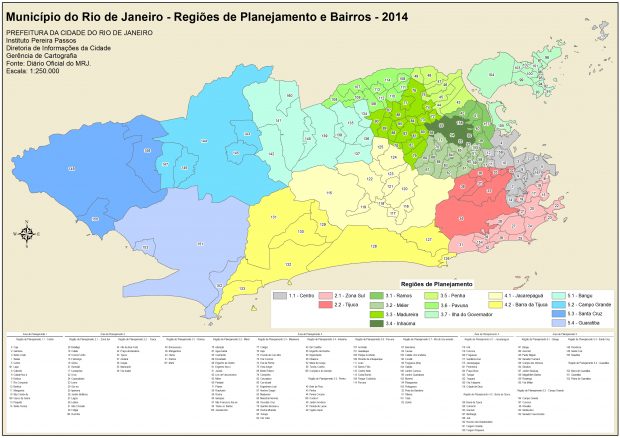
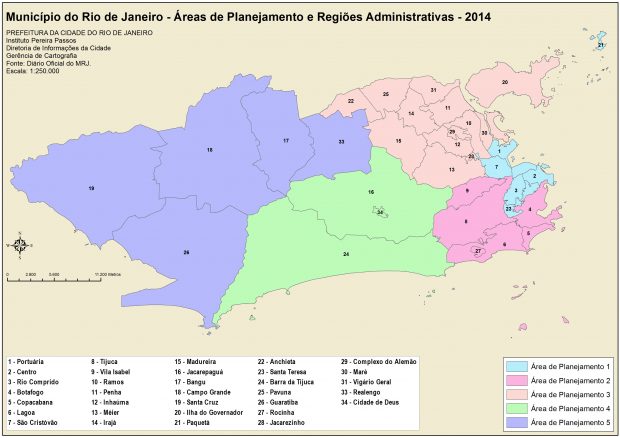
The city of Rio is divided into geographical and administrative areas which assist the management and public policy administration of the city. Listed in order of size from smallest to largest, the areas are: Neighborhoods, Administrative Regions, Planning Regions and Planning Areas.
Social Indicators
Maps like these provide us with interesting characteristics regarding the distribution of Rio’s inhabitants, looking at factors like skin color, income, housing type and population density:
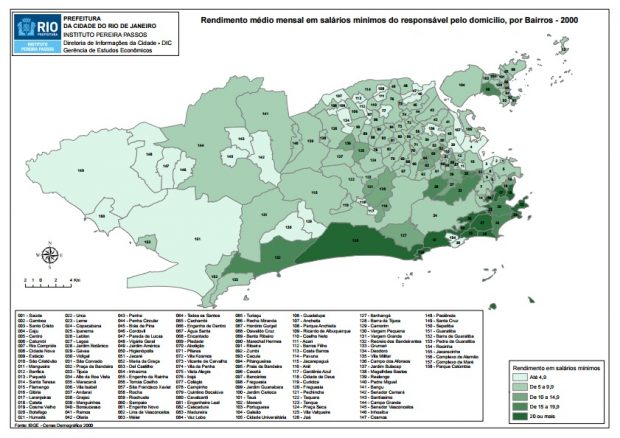
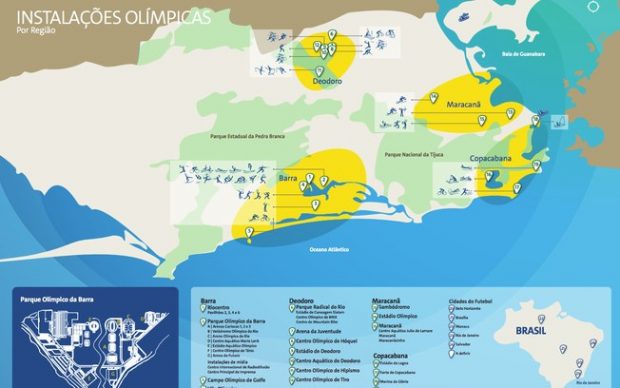
Looking at the income map, we can see that the highest concentration of wealth is in Planning Areas 2 and 4; in other words, the coastal neighborhoods, as well as Grande Tijuca (comprised of the neighborhoods Tijuca, Maracanã, Andaraí, Vila Isabel and Grajaú). When we look at where those areas are compared with some of the Olympic investment projects, we can see that the criticisms that Olympic investment are only in rich areas are backed up by geography:
A key piece of marketing from Rio’s mayor was the concept of a “bike friendly” city. It was announced that 450km of cycle paths would be built by 2016. The 450km target has not been met, but the important thing is to note where the cycle paths have been built. Let’s check the map:
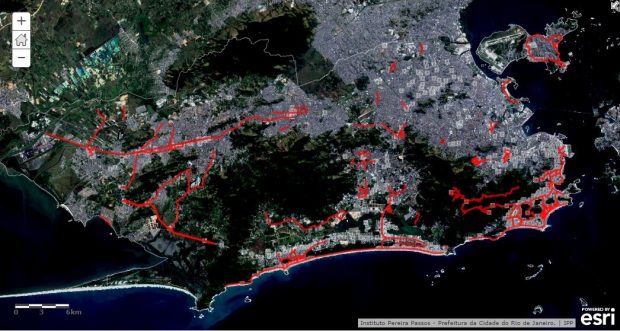
On the cycle path map, we see again there has been a lot of investment in Planning Areas 2 and 4, with a few other paths in the Planning Area with the most disperse population of the city: Planning Area 5, the West Zone. But how much of this cycle path provision actually serves the population of Rio de Janeiro? Let’s have a look at Rio’s population density:
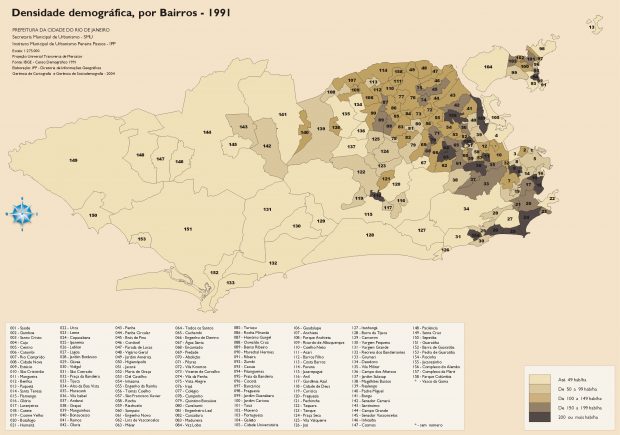
We can see that the cycle path policy does not reach the most densely populated low-income parts of the city.
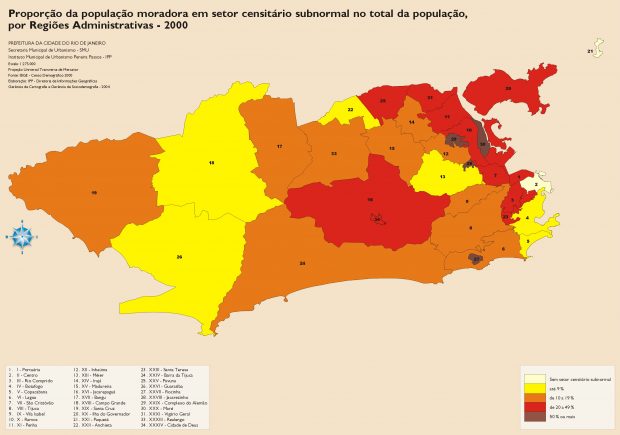
Nor did the cycle paths serve the “Subnormal Agglomerations,” which is how the Brazilian Geography and Statistics Institute (IGBE) refers to favelas. On this map we can see a large concentration of such “Subnormal Agglomerations” in Planning Area 3, the North Zone, which is where a large proportion of Rio’s residents live. Planning Area 3 has twice the number of inhabitants as Planning Area 2 (South Zone), and more than double the number of residents of Planning Area 4 (Barra da Tijuca and Jacarepaguá), which is the area where the “Olympic Legacy” is concentrated.
According to the 2010 census, the population of Rio de Janeiro is distributed among the Planning Areas as follows:
| Planning Area 1 | 5% |
| Planning Area 2 | 16% |
| Planning Area 3 | 38% |
| Planning Area 4 | 14% |
| Planning Area 5 | 27% |
Using 2013 figures from the Pereira Passos Institute (of urban planning), we can see how leisure areas built to serve the population are spread out among the Planning Areas in the following way:
| Planning Area 1 | 8% |
| Planning Area 2 | 20% |
| Planning Area 3 | 12% |
| Planning Area 4 | 34% |
| Planning Area 5 | 26% |
Despite the fact that Planning Area 3 (North Zone) has the largest number of inhabitants and the largest population density, it is Planning Areas 2 (South Zone), 4 (Barra and Jacarepaguá) and 5 (West Zone)–areas already served by the largest numbers of leisure spaces–which are those that have been earmarked to receive more leisure spaces as part of the Olympic Legacy.
Parque Madureira, launched in 2012, has not resulted in an increase to the amount of leisure space in Planning Area 3, since other neighborhoods in the same Planning Area have had a reduction in their leisure space.
When Praça Mauá in the Port Region is completed, it will contribute to an increase in access to leisure areas in Planning Area 1 (Central Rio), thus all areas will have received a bit more leisure space, with the exception of Planning Area 3. The government has sneakily tried to balance this out by implying the neighborhood of Deodoro is in the North Zone, part of Planning Area 3. This is despite the fact that Deodoro is part of the Realengo administrative region, which is in the West Zone, in Planning Area 5. So now who’s the one who doesn’t know the geography of the city of Rio?
Other indicators linked to geography, made available by the Pereira Passos Institute, show additional geographical inequalities in the the city. Take, for example, green space. This table shows the proportion of each Planning Area which is composed of green areas:
| Planning Area 1 | 14,8% |
| Planning Area 2 | 49,3% |
| Planning Area 3 | 7,7% |
| Planning Area 4 | 43,4% |
| Planning Area 5 | 31,9% |
To sum up, Planning Area 3 (North Zone) has the most habitants, is the most densely populated, has the largest number of favelas and is the area with the lowest amount of leisure or green space, which are fundamental for health.
When we look at figures showing the use of land for housing, we see again how the population density of Rio is skewed, with Planning Area 3 being the area with the largest proportion of its land used for housing.
| Planning Area 1 | 40,6% |
| Planning Area 2 | 33,6% |
| Planning Area 3 | 62,1% |
| Planning Area 4 | 25,9% |
| Planning Area 5 | 26,7% |
The Tijuca Forest, beaches and the Rodrigo de Freitas lagoon form a large part of Planning Area 2.
Apartheid?
If we compare the Planning Areas in the city, studied in this article, with the distribution of the black and mixed race population in the city, we can reach the following interpretations:

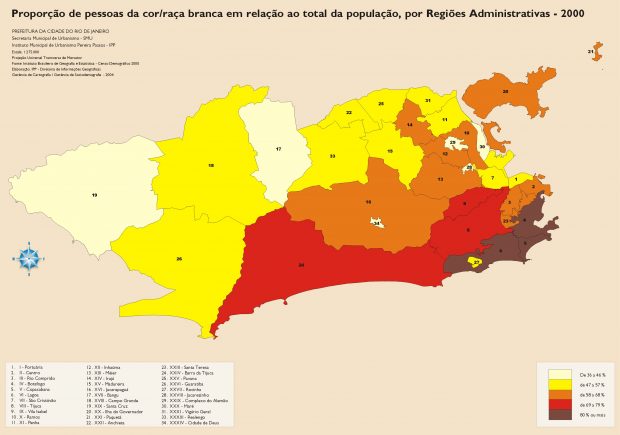
Looking at this information, we might ask the mayor the following question: “how does the geography of the ‘Olympic City’ look to you?”
Hugo Costa, 41, has a degree in Geography from the Federal Fluminense University, is an aspiring blogger and lives in the neighborhood of Ramos in the North Zone of Rio.
