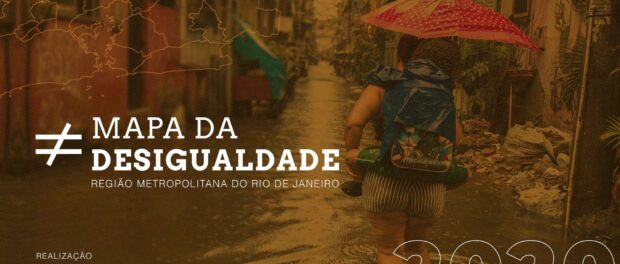
In July, the Casa Fluminense research and action group working on metropolitan-scale policies in Rio de Janeiro, released its latest version of the Inequality Map, which presents a panorama of indicators from 22 municipalities in the Rio de Janeiro metropolitan area. The indicators cover ten thematic pillars: social welfare, culture, education, employment, public management, housing, sanitation, health, security, and transportation. They are aligned with the United Nations’ Sustainable Development Goals (SDGs) and aim to achieve those goals agreed upon by UN member nations. According to Casa Fluminense, the themes are approached intersectionally, “their content overlapping with values related to economic, racial, gender, and socio-environmental justice.”
In the livestreamed presentation of the map, Vitor Mihessen, Information Coordinator at Casa Fluminense, highlighted the context in which the map is being released and discussed the challenge and responsibility involved in such a large-scale survey being launched in the midst of a pandemic, which further exposes inequalities in the state of Rio. He reflected that “the first step towards change is a diagnosis of the crisis.” The organization used data from governmental sources as well as from citizen groups that have been fighting for increased transparency and visibility due to authorities’ failure to generate reliable and up-to-date data.
This piece highlights indicators from seven of the thematic pillars in order to showcase extreme racial and socioeconomic inequality in the state of Rio, a reflection of a country that is also unjust. The Inequality Map noted that “Brazil has the second highest concentration of income in the world and loses only to Qatar in income inequality, according to a UN report. Less than 3% of Brazilian families concentrate 20% of the entire country’s wealth, according to the Brazilian Institute of Geography and Statistics (IBGE).”
1- Public Administration
The map reveals that “in Itaguaí, where 60% of residents are black, there were only two black city councillors among the 17 legislative members.” A report from the newspaper O Globo identified the same problem at the federal level. Of the 594 federal legislators, only 17.8% are black. However, according to the 2016 Continuous National Household Sample Survey by IBGE, Brazilians who identify as pardo, the Brazilian term for brown or mixed race (46.7%) and black (8.6%) amount to 54.1% of the country’s total population.
2- Security (Police Violence)
The map reports that “in 2018, 1,534 homicides resulted from police intervention in the state of Rio de Janeiro. According to the Brazilian Forum on Public Safety, this indicates that one in every four homicides were committed by agents of the Brazilian government.” In 2019, the first year of Governor Wilson Witzel’s term, police lethality in Rio reached a level unseen since 1998.
An alarming fact is that even with the reduction in crimes such as homicides and robberies in Rio de Janeiro during the pandemic, there was a 43% increase in killings by police officers during the quarantine, according to numbers published by the Rio de Janeiro state government’s Institute of Public Security (ISP).
3- Employment (Pay Gap Between Whites and Blacks)
According to IBGE, formal and informal white workers in Brazil earn 75% more than black and pardo individuals. For formal jobs, “white workers in Rio de Janeiro earn 41.9% more than blacks,” reveals the map.
At a national level, according to a report from the newspaper Folha de São Paulo and data from Instituto Locomotiva, “the wage gap is still significant, reaching 31% when the salaries of whites and blacks with university degrees are compared, after all other variables have been accounted for. The only variable left is skin color.” These data reveal yet another scenario where structural racism undermines black and pardo individuals.
4- Education (Enrollment in Daycare)
Considering the percentage of children aged zero to three enrolled in daycare, Taynara Cabral, a communications officer at Casa Fluminense, emphasized the importance of early childhood in child development and pointed out additional data from the map: “When we look at the cities of Nova Iguaçu, Queimados, and Japeri, only 6% are enrolled in daycare.”
5- Health (Average Age at Death)
“In the Rio de Janeiro metropolitan area, Niterói residents live, on average, twelve years longer than residents of Queimados. In Rio de Janeiro proper, the disparity between the wealthy neighborhood of São Conrado and the nearby favela of Rocinha is 23 years. The difference registered between Ipanema and Rocinha is 29 years, the highest registered in the municipality,” the map reveals. Taynara interpreted these data as showing “who the public policies have been in fact working for and who has access to them.”
6- Basic Sanitation
“The Ministry of Health registered 1,774 deaths caused by environmental disasters in Brazil between 2010 and 2018. Of these deaths, over two thirds (1,263) occurred in the state of Rio de Janeiro,” the map reports.
Regarding sewage treatment, the map reports statistics from the Rio de Janeiro State Environmental Institute (INEA): “there are 437 sewage treatment stations in the Rio de Janeiro metropolitan area, but 134 of them are inoperative.”
7- Culture (Museums)
Rio de Janeiro proper is home to 136 museums. Meanwhile, there is not a single museum in Queimados, Paracambi, Japeri, Rio Bonito, or Tanguá. By exposing this discrepancy, the Inequality Map “seeks to stimulate reflection on historical erasures and the identification of new places of memory and representation beyond the official versions.”


