This is our latest article on Covid-19 and its impacts on the favelas, originally published in Fiocruz’s Radar Covid-19 in Favelas.
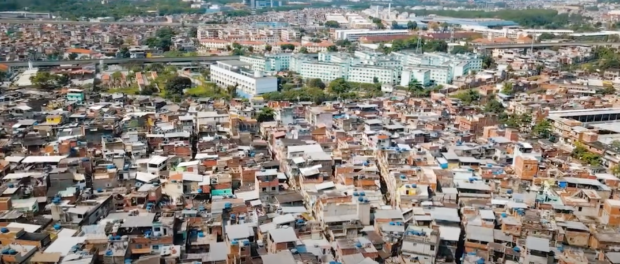
This month, the Covid-19 in Favelas Unified Dashboard, developed through 24 favela-based collectives and allies, with the support of technical experts from Brazil’s national health foundation, Fiocruz, marks one year since its launch. The dashboard’s latest update, on July 16, documented nearly 80,000 cases and over 6,000 deaths across Rio’s favelas since the beginning of the pandemic, this despite chronic underreporting and low testing, and covering only 70% of favela households in the city of Rio. In other words, the real figures are much higher. Still, since the beginning of the pandemic, the number of deaths confirmed in our city’s favelas is greater than that of 166 entire nations.

The proposal for the Unified Dashboard emerged at the beginning of the pandemic, in April 2020, when grassroots organizations participating in projects organized by Catalytic Communities (CatComm)* reported weekly cases and deaths in virtual meetings of the Sustainable Favela Network (SFN). Upon hearing about these cases, and since it had already been reporting on the pandemic through RioOnWatch, CatComm set up a spreadsheet to follow up on cases reported through its community networks. These cases were added to those reported through Voz das Comunidades and Fala Roça, community newspapers that were reporting cases in various favelas, plus those disclosed by newspapers. The city government, however, was not making any attempt to survey favelas—although we knew, since the beginning of the pandemic, that favelas would be our city’s most vulnerable regions.
In order to meet this demand for data from favelas, so that preventative actions could be taken and strategic support given, and due to the lack of action by government, CatComm started to meet with the community groups and collectives that were on the frontline of Covid-19 response in their territories. This was in May 2020, when CatComm simultaneously managed, through international partners, to connect with the global mapping company Esri, which volunteered an engineer for a month to set up the Covid-19 in Favelas Unified Dashboard.
 During the collectives’ weekly meetings, in June 2020, the Dashboard was developed, with technical aspects realized by the engineer, and data collection realized by the collectives, primarily via local rapporteurs. These ranged from groups collecting data through online forms, going door-to-door, or analyzing the city’s data whenever possible. Others received relatives of patients in their headquarters and counted up the cases, or collected data at local health clinics or through WhatsApp.
Finally, the Dashboard was launched on July 9, 2020 at a virtual press conference, reflecting data from 123 favelas, with presentations made by the member collectives highlighting its importance. Since then, three more press conferences have taken place, each time calling attention to new data and to alarming situations of vulnerability. Holding the press conferences is always a collective decision made by members during weekly (in 2020) and biweekly (in 2021) meetings. At these meetings, where unfolding events and emotional experiences of the pandemic in each territory are regularly shared, the weighty situation is narrated by the local leaders themselves and critical moments are identified before the press take notice. Dashboard members therefore recognized the importance of holding press conferences.
Three campaigns were also carried out. The first, #DadosSalvamVidas (Data Saves Lives) was launched on social media as a video developed by Jacarezinho‘s LabJaca. Its objective is to communicate the importance of collecting data in favelas and to carry out actions based on those data which will guarantee survival. The campaign also used the hashtag #DadosSãoPoder (Data is Power) because, without data, there are no public policies.
The second campaign, #VacinaPraFavelaJá (Vaccines for Favelas, Now!), was launched with the arrival of vaccines in Brazil, drawing attention to the numerous reasons why the vaccine should be prioritized in favela territories. Renowned cartoonist Carlos Latuff provided a cartoon for the campaign, which was sent to all Rio de Janeiro city councillors and signed by 48 institutions.
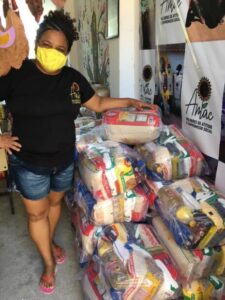
Finally, an international campaign against hunger and for food baskets was carried out for the collectives involved in the Dashboard, bringing in over US$2200 in donations for basic food baskets, realized in partnership with small organic farmers in Greater Rio, effectively supporting “both ends” at a critical moment.
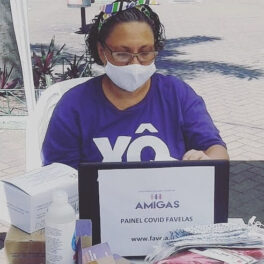
 Gradually, Dashboard members identified new sources of data. A technical note was developed by the project’s technical volunteers, and back-end data were released for analysis by researchers and journalists. New groups joined the meetings, such as the women’s collective A.M.I.G.A.S from Itaguaí, which had been collecting data door-to-door in five favelas. With no prior place to disseminate their data, they found a welcome home in the Dashboard, where they cast a sad shadow when their data showed their communities in second place. Over time, the Dashboard also relied on the expertise of Renata Gracie, a researcher at Fiocruz’s Institute for Scientific and Technological Communication and Information in Health (ICICT), who developed a technique to identify “Areas of Influence by Zip Code” for any favela. Through this survey, using existing maps to identify likely zip codes used to reflect each favela, one by one, she discovered a way to harness public data by favelas. Dashboard organizers then partnered with another volunteer initiative, Covid by Zip Code, which provided data for the Zip Codes identified, which were then included in the Dashboard, enabling it to cover 330 favelas today, 324 of them within the municipality of Rio and six in neighboring municipalities.
 Working closely with data and with those responsible for frontline prevention in the most vulnerable areas of our city has enabled members to gain a deeper understanding of the pandemic. During regular meetings, the exchange of information is very rich, clarifications are provided and mutual support is guaranteed.
It is common for the press, which has worked to cover the pandemic in favelas, and which has regularly accessed data from the Unified Dashboard, to come to wrong conclusions: for example, looking at the Dashboard and seeing Complexo da Maré first, they often assume that this is the result of greater contagion in Maré than in other communities. The truth is practically opposite: Maré ranks first because of the quality of data collection being carried out there: data which have helped inform actions through the pandemic to keep death rates relatively low. Maré’s data on the Unified Dashboard is that collected by NGO Redes da Maré, a community institution with a significant presence in all the favelas that make up the Maré complex, the only organization successful in realizing mass testing. The fact is that Maré is perhaps the only favela where data comes close to reflecting reality.
With the Unified Dashboard marking one year since launch, its members have set up registration for the general public to participate in a new live event, on July 22, at 2pm, to look back on the impact of the pandemic in their territories over the course of the past year, and talk about the current situation. A historical data set will also be presented for the first time, covering the 330+ favelas currently covered by the Dashboard, since the beginning of the pandemic. What this analysis—and the entire proposal and realization of the Dashboard—demonstrates is simple: data collection in and on favelas is not rocket science. It has been carried out now for a year by a group of volunteers and civil society newcomers to data gathering. Can you imagine what could have been done if the city had fulfilled its role since the beginning of the pandemic, and collected data in real time to provide an immediate response to the situation?
Find out more and sign up for the live event marking one year of the Dashboard, this July 22, at 2pm.
Get to know the 24 collectives and allies that make up the Covid-19 in Favelas Unified Dashboard: A.M.I.G.A.S. | Associação Vó Cleusa | Centro Comunitário Raiz Vida | Centro Social Fusão | Coletivo CDD | Coletivo Conexões Periféricas-RP | Catalytic Communities | Covid por CEP | Data_Labe | Dicionário de Favelas Marielle Franco | Fala Roça | Favela Vertical | Fiocruz | Fórum Grita Baixada | Frente de Mobilização da Maré | Instituto Educacional Araujo Dutra | LabJaca | Maré de Notícias | Marias em Ação | Mulheres de Frente | Observatório de Favelas | PerifaConnection | Redes da Maré | SOS Providência | TETO.
*RioOnWatch, the Sustainable Favela Network, and the Covid-19 in Favelas Unified Dashboard are Catalytic Communities initiatives.


